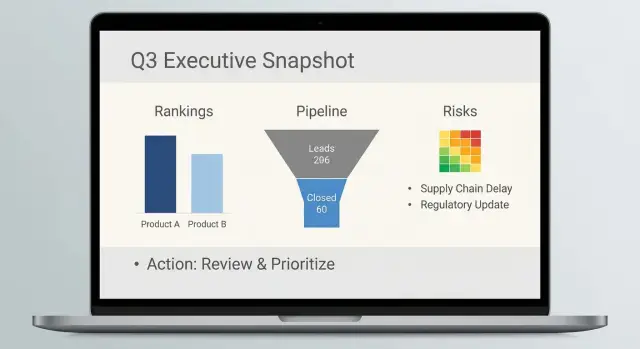
Executive backlink reporting template: a one-slide report execs use
Use this executive backlink reporting template to show links built, ranking movement, pipeline impact, and risk flags that need attention.
What executives need from backlink reporting
Executives don’t ask for backlink updates because they want SEO details. They ask because they want to know what changed, whether it’s working, and whether anything introduces risk.
A good executive backlink reporting template turns link work into the kind of update they expect from sales, finance, or product: clear movement, clear meaning, and clear next steps.
Most leaders are scanning for one thing: are we making progress, and is it safe to keep doing this? If your report answers that in plain words, you’ll get faster decisions and fewer follow-ups.
The 3 questions your slide must answer
Your one-slide update should make these three answers obvious within 10 seconds:
- What did we do since last time (in one sentence)?
- What changed in outcomes we care about (rankings, traffic, pipeline), and how confident are we?
- What needs a decision or attention now (budget, approvals, risk fixes)?
What’s missing on purpose: deep SEO explanations. Execs want the “so what,” not the mechanics.
Plain language beats SEO jargon
You can be accurate without sounding technical. Use labels that match business thinking. For example, say “search visibility for priority pages” instead of “SERP performance,” and “new referring sites” instead of “referring domains.”
If you must use an SEO term, define it once in a short parenthesis, like “Domain Authority (a rough trust score).”
A simple rule: if a smart person outside marketing wouldn’t say the word in a normal meeting, don’t put it on the slide.
What not to include on an executive slide
The fastest way to lose trust is to flood the slide with numbers that don’t change decisions. Skip big raw link lists, anchor text tables, screenshots, and tool metrics with no connection to outcomes.
Also avoid:
- Revenue claims you can’t explain in one sentence
- Keyword charts full of long-tail noise
- A long action plan with no owner or decision point
Execs respect a short report that highlights risk early and shows steady progress on a few outcomes they already track.
The one-slide structure (a simple layout that works)
A one-slide SEO report works when it answers three questions fast: what happened, so what, and what could go wrong.
A layout that tells the story top to bottom
Start with a clear top line, put the evidence in the middle, and keep risks at the bottom.
- Top (headline + takeaway): one sentence a leader can repeat.
- Middle (the story): 2-3 simple tiles that connect link actions to visible movement.
- Bottom (risk flags): a few quick checks that protect trust.
Put the takeaway at the top-left and make it specific and time-bound, for example: “We added 6 quality links in January; priority pages improved; no quality issues detected.”
Avoid promises like “these links caused rankings to rise.” Save that nuance for the middle section.
Show progress vs last period in one glance
Execs compare periods, not spreadsheets. Build comparisons into every tile so nobody has to guess.
A simple middle row is three tiles, each with the same pattern: current value, last period value, and a +/- change. Keep labels plain, like “New quality links,” “Priority keyword positions,” and “Qualified leads from organic.”
If you include one chart, choose a small trend line for rankings or organic leads, and mark the month the links went live.
Add a one-line scope note under the tiles: which pages you focused on and the time window.
When a second slide is worth it (and when it isn’t)
Add a second slide only when the first slide would turn into a debate.
Use a second slide when there’s a meaningful anomaly (suspicious links, lost links, sudden drops), a strategy change (new pages, regions, products), or when the exec keeps asking, “Where did this come from?”
Skip the second slide if you only want room for a bigger table. Keep extra detail in your working doc.
Metrics to include (and how to name them plainly)
Good reporting works when every metric answers a simple question: what changed, why it matters, and whether it’s safe.
Start with link actions because that’s what your team controlled: new links, lost links, and net change. If you add one detail, make it a small note like “new links to money pages” (product, pricing, demo).
For “authority,” avoid acronyms and long explanations of third-party scores. Instead, describe quality in terms people recognize: well-known publications, established niche sites, and smaller blogs. Pair that with relevance in plain words (for example: “data security,” “HR software,” “developer tools”).
Five labels that tend to stay clear and defensible:
- Links added (count): new live links found this period
- Links lost (count): links that disappeared or were nofollowed
- Net link change (count): added minus lost
- Search visibility (selected terms): up/down for 5-10 business-critical searches
- Pipeline influenced ($ or leads): one number, plus a one-line source note
For rankings, don’t show long keyword lists. Pick a small set tied to revenue: brand terms, a few “buy” terms, and a few problem terms. Many execs understand “moved from page 2 to page 1” faster than a dense graph.
For pipeline, stick to one headline number (often SQLs or demos) and add one short source note (CRM attribution, form fills by landing page, assisted conversions).
Finally, lock your time windows. Use the same reporting period each month (for example, the last full calendar month) and the same comparison (month-over-month). Consistency keeps the slide honest.
Tie link actions to ranking movement without overclaiming
If you want an executive to trust the slide, don’t claim “links caused the ranking jump.” Show what you did, what changed, and what else could explain it.
Start by narrowing scope. Track 5-10 priority pages or themes that matter to revenue or reputation.
A practical set:
- Top 3 money pages (pricing, product, demo)
- 2-3 pipeline drivers (integration, use case, industry page)
- 1-2 strategic bets (new feature, new market)
For each page or theme, use a small before/after snapshot for a handful of keywords, not a giant table. Pick 3-5 keywords per page: one core term, one longer phrase, and one comparison term.
Add one sentence that sets expectations: “Link work often shows up in rankings weeks later, so this month’s actions may explain part of next month’s movement.”
To avoid mixing causes, include a quick check for brand demand. If branded searches spiked because of PR, ads, or an event, call that out. If branded demand stayed flat while priority non-brand terms improved, that’s a cleaner story for link support.
Keep annotations consistent: “Link action -> observed movement.” For example: “2 new placements to Feature Page -> 6 keywords moved from page 2 to page 1.”
Connect backlink work to pipeline impact (the executive view)
Pipeline impact should mean something the business already tracks: leads, SQLs, and revenue (or influenced revenue). Pick one primary outcome for the slide and keep the rest as supporting context.
If marketing and sales don’t agree on definitions, your report becomes a debate instead of a decision.
A simple approach you can explain quickly: compare performance for pages you supported with links versus similar pages you didn’t. Use a short window (4-6 weeks) and focus on direction, not precision. You’re not claiming each link “caused” a deal. You’re showing whether supported pages started producing more business activity.
When last-click is misleading (often), report assisted impact. One clean method: track conversions that included at least one organic visit before the conversion, then label that “organic-assisted.” If you can, add a second layer: “organic-assisted conversions that touched supported pages.”
Pipeline metrics that fit on one slide:
- Leads from organic (this month vs last month)
- SQLs from organic (this month vs last month)
- Influenced pipeline: $ value of deals where the account had an organic touch
- Notes: 1-2 sentences on what changed and why
If there’s no clear pipeline signal yet, say so and anchor expectations. Early link work often shows up first in rankings and traffic, then leads, and only later revenue.
A note template you can paste into the slide:
“Sales note: [X accounts/deals] mentioned [problem/need]. Organic visits to [supported page/topic] increased, and [Y] of these accounts had an organic touch before the first call. No revenue claim yet; watching SQL-to-close over the next [timeframe].”
Risk flags and quality checks to keep trust high
Execs trust backlink updates when you also show what could go wrong and what you’re doing to prevent it. Add a small “Risk and quality” box at the bottom of the slide.
Simple risk buckets (with plain triggers)
Use three levels and keep the wording consistent month to month:
- Low: links look natural, fit the topic, and the pace is steady
- Medium: something to watch (clusters of similar sites, repetitive anchors, links not indexed yet)
- High: clear signs to act (sudden spike, sitewide links, strong ranking drop lined up with link loss, unrelated or spammy placements)
Quality checks that are easy to explain
Don’t list every metric. Show 4-5 checks you run every month so leaders know there’s a guardrail:
- Topic fit: does the linking page match what the company actually does?
- Placement type: normal editorial mention vs risky placement (footer/sidebar across many pages)
- Anchor mix: mostly brand and natural phrases, not the same keyword repeated
- Indexation: can search engines find the linking page?
- Destination stability: does the link point to a live page without messy redirects?
Two patterns deserve a direct red-flag line:
- Velocity: “New links were 3x higher than normal this month.”
- Loss: “Two high-value links disappeared” or “linking page was redirected.”
End with a clear escalation line: “Action needed this week,” plus an owner. If a key link was removed, the options are simple: restore it, replace it, or improve the target page so future links point somewhere stable.
Step-by-step: build the slide in 30 minutes
Treat this like a status update, not a data dump. The goal is one clear takeaway backed by a few numbers that answer: what changed, why it likely changed, and what happens next.
A 30-minute build flow
-
Set the time window and baseline (5 min). Pick a period everyone recognizes (last full month, quarter-to-date). Choose one baseline date for comparisons and write it on the slide.
-
Collect link actions and group them (8 min). Pull what you actually did: new links added, links lost, and links updated (for example, switching to a better target page). Group by intent, such as “homepage authority,” “product page support,” or “repair work.”
-
Capture ranking movement for priority pages (7 min). Choose 3-5 priority pages. For each, record the main search term and the position change since the baseline. “Moved from #12 to #8” is often enough.
-
Add pipeline impact with one sentence of context (6 min). Pull numbers execs already trust: leads, demos, trials, revenue, or influenced pipeline. Add one sentence on what else changed (campaign launch, seasonality, pricing changes) so you don’t over-credit links.
-
Add risk flags and next actions (4 min). Note anything that could hurt trust: unusual spikes, low-quality sources, lost important links, or a ranking drop on a key page. Then list 1-2 actions for next period.
Finish with a single headline that combines the story: one action, one result, one caution. Example: “Added 6 high-authority links to two product pages; both moved into the top 10; one key link was lost and is being replaced.”
Example scenario: a monthly update an exec can read in 60 seconds
Picture a mid-market B2B SaaS company (about 40 employees) selling compliance software to finance teams. The quarterly goal is to increase demo requests from organic search without raising brand risk. The CEO wants one slide each month that answers: what changed, why, and what to do next.
This month’s link actions were simple. The team secured six new placements on relevant industry sites and refreshed three older placements by updating the target page to match search intent. Two planned placements were paused because the sites changed ownership.
Rankings moved in a mixed but believable way. The “compliance reporting software” page improved from position 11 to 7, crossing onto page 1. Two other priority terms stayed flat at positions 4 and 5, which is fine. One term slipped from 6 to 8, and the team noted it happened the same week a competitor published a new comparison page.
Pipeline signals were treated as clues, not promises. Organic demo requests rose from 18 to 22, but only two were clearly tied to the improving page (tracked via landing page in forms). The team also noted that revenue impact may lag.
Risk flags showed up and were handled visibly:
- One new referring domain looked off-topic after publication, so it was reviewed and replaced the next week.
- Anchor diversity dipped (too many similar phrases), so next month’s plan shifts toward more branded and URL-style anchors.
- A fast spike in links to one page triggered a pacing note, so next placements are spread across two supporting pages.
The exec takeaway sentence looked like this:
“We added 6 quality links, moved one key page onto page 1, saw a small lift in organic demos, and caught one quality issue early; next month we focus on supporting pages and a safer anchor mix.”
Common mistakes (and how to fix them fast)
The fastest way to lose exec trust is to sound certain when the data isn’t. Keep the report readable, consistent, and honest about what you know vs what you suspect.
Mistake 1: “Links caused revenue” (without proof)
When a report says, “Backlinks drove $120k,” leaders will ask how you know. If you can’t answer in one sentence, don’t claim it.
Use wording that matches the evidence: “After links went live, rankings improved for 6 target pages, and demo requests from organic search rose 12% month over month. We can’t prove direct cause, but timing and page-level movement support the connection.”
Mistake 2: Too many metrics and tiny charts
If it needs zooming, it won’t get read. One slide can only hold a few numbers.
Keep it to the 3-5 figures an executive uses to make decisions: movement, impact, risk. Put details in notes or a backup slide, not on the main one.
Mistake 3: Reporting link counts only
“12 new links” is activity, not a result. Pair actions with outcomes: “Links added to 3 product pages -> 2 pages moved from positions 8-12 into 4-7.”
Mistake 4: Hiding risk or bad news
Bad news isn’t the problem. Surprises are.
Add a risk line every month, even if it says “No new risks observed.” When there is a risk, name the next step: “2 links removed by publishers; replacements requested; monitoring ranking stability for affected pages.”
Mistake 5: Changing the tracked set every month
If you swap pages, keywords, or attribution rules often, the trend stops meaning anything.
Lock a baseline set (pages + terms + pipeline metric) for at least a quarter. If you must change it, say it plainly: “Baseline changed this month due to site restructure; prior months aren’t directly comparable.”
Wording patterns that stay clear and safe:
- “We observed X after Y” (not “Y caused X”)
- “Likely contributors include…” (not “The reason is…”)
- “Early signal” for 2-4 weeks of data; “trend” for 2-3 months
- “No decision needed” vs “Decision needed: approve more placements for these pages”
Quick checklist and next steps
Before you hit send, make sure the slide reads like a business update, not an SEO status dump.
Pre-send checklist (60 seconds)
- Numbers match everywhere (same date range, totals, rounding).
- Every metric has a plain definition (one short phrase, same wording each month).
- The headline says three things: what you did, what moved, what happens next.
- The story stays consistent: actions, results, and uncertainty all line up.
- Risk flags are explicit (links to review, suspicious anchors, sudden loss of key links).
Once the slide is accurate, make it actionable. Executives don’t want five options. They want one clear decision, or a simple “no decision needed.”
Next steps (keep it concrete)
Write 2-3 sentences at the bottom of the slide:
- What you’ll do next month (example: “Secure 3-5 new authoritative placements for the product pages that slipped 2-3 positions”).
- Why it’s the priority (example: “Those pages drive the highest conversion rate from organic traffic”).
- One ask, if needed (example: “Approve budget for 2 additional placements” or “No approval needed this month”).
If you need high-authority placements quickly, a curated inventory can be a practical option. For example, SEOBoosty (seoboosty.com) focuses on securing premium backlinks from highly authoritative sites; you still decide which pages to support and keep the same risk checks in your reporting.
Send the slide with a subject line that matches the headline, and you’re done.
FAQ
What should the headline of an executive backlink slide say?
Start with a single sentence that combines action + outcome + risk status. For example: “Added 6 quality links to priority pages; one page moved onto page 1; no quality issues detected.” That headline should be understandable without any SEO context.
What’s the minimum I should include on a one-slide backlink report?
Include only what answers three things: what changed, why it matters, and what needs a decision. A practical minimum is links added/lost, a small set of priority rankings or visibility, one pipeline number, and a short risk note.
How do I show progress without a big spreadsheet?
Use period comparisons everywhere: current value, last period value, and the +/- change. Executives scan for movement, not totals, so showing month-over-month (or quarter-to-date) changes makes the slide readable in seconds.
How do I remove SEO jargon without losing accuracy?
Rename metrics into business language and define any unavoidable SEO term once. “Search visibility for priority pages” is clearer than “SERP performance,” and “new referring sites” is clearer than “referring domains.”
What should I avoid putting on an executive backlink slide?
Skip raw link lists, anchor text tables, tool-only scores with no outcome tie-in, and tiny charts that require zooming. If a number can’t change a decision, it doesn’t belong on the exec slide.
How do I connect link work to rankings without overclaiming?
Don’t claim causation. Report it as timing and scope: what links went live, what pages were targeted, and what ranking/traffic movement followed. Add one short sentence about other possible contributors (PR, seasonality, site changes) to keep trust high.
How do I tie backlinks to pipeline in a way executives accept?
Pick one pipeline metric leadership already trusts (leads, SQLs, demos, or influenced pipeline) and compare it to last period. If the signal is early, say it plainly and set expectations that pipeline impact often lags ranking movement by weeks or months.
What risk checks should I show to keep exec trust?
Use a simple three-level system (Low/Medium/High) with plain triggers like unusual velocity, off-topic placements, repetitive anchors, lost key links, or sudden ranking drops. Always include the next action and an owner so risks feel managed, not hidden.
When is it worth adding a second slide?
Use a second slide only when the first slide would create debate: a suspicious link cluster, meaningful link loss, a sudden drop, or a strategy shift (new product/pages/regions). Otherwise, keep detail in your working doc and keep the exec update tight.
How do I keep the report consistent month to month?
Lock the same time window, the same priority pages/terms, and the same pipeline definition for at least a quarter. If you must change the baseline (site restructure, tracking change), call it out clearly so trends don’t look manipulated.