Search Console link-to-query mapping with the API report
Learn Search Console link-to-query mapping to connect new referring pages with impression and position changes for each URL using the GSC API.
What you are trying to measure (and what you are not)
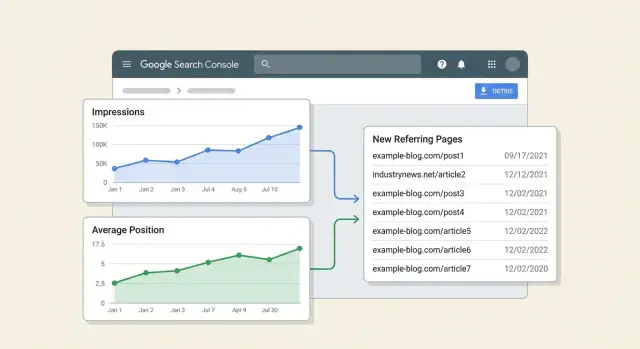
Search Console link-to-query mapping puts three things in one view: a specific page, the queries that page appears for, and the referring pages that started linking to it.
The goal isn't to prove a link caused a ranking jump. Google doesn't label impressions or clicks with “this happened because of link X,” and rankings move for plenty of other reasons (content edits, internal linking, seasonality, competitor changes, and Google updates). Timing is also messy. A link can go live today and be discovered days or weeks later.
A practical goal is simpler: connect new referring pages to changes in impressions and average position for the exact URL, by query. That gives you a usable story like: “This page gained new links, then visibility improved for these queries.” It's correlation with guardrails, not courtroom proof.
What this report can tell you
Used carefully, a Google Search Console API report like this can answer a few high-value questions:
- Which queries for a URL gained or lost impressions after new referring pages appeared.
- Whether that URL's average position trend improved, stayed flat, or dropped in the same window.
- Which newly linking pages line up with the biggest changes, so you know what to review first.
What this report cannot tell you
This report can't reliably:
- Assign credit to one link or calculate an exact “link value” per query.
- Separate link impact from other SEO work without extra controls.
- Guarantee Google counted or trusted a link just because it exists.
Example: your pricing page gains two new links from industry articles. Over the next 14 days, impressions rise for “product pricing” and “enterprise pricing,” while “free trial pricing” stays flat. That doesn't prove the links caused the lift, but it does show the page started appearing more often for certain searches after new referring pages showed up.
If you're using a placement service such as SEOBoosty (seoboosty.com) to point premium backlinks at a specific page, this mapping is also a sanity check. It keeps you focused on whether that URL's query visibility moved, instead of relying on sitewide averages.
The data you will combine from Search Console
You need two different views from Search Console. One shows what happened in search (impressions, clicks, position). The other shows which pages on the web link to you.
1) Performance data (what changed in search)
This comes from the Performance report in Search Console (via the Search Analytics endpoint in the API). It's the clearest way to measure outcomes like impressions and average position.
Pull metrics like clicks, impressions, CTR, and average position, and group them by dimensions that explain what moved. For this report, the most useful dimensions are page, query, and date. Country and device can help if you have mixed markets or strong mobile vs desktop differences.
A practical rule: always include page. Add query when you want to know which searches changed, not just whether the page changed.
2) Links data (what changed off-site)
This comes from the Links report in Search Console (via the links endpoints). It's where you find the referring pages that point to your site.
For link-to-query mapping, the fields you care about are:
- target page (which of your URLs the link points to)
- linking page (the specific external page that links)
- linking site (the domain, useful for rollups)
Links data does not tell you which query a link impacted. It only tells you the link exists to a given target page. Any “attribution” in your report is based on timing and the affected URL, not a proven cause.
Why you need “before” and “after” windows
Links and rankings don't change on the same day, and Search Console data isn't perfectly real-time. Looking at a single date creates noise.
Use two equal time windows for performance data:
- a “before” window to set a baseline
- an “after” window to measure change
Then line up new referring pages by the first time you saw them (or the earliest date you can assign), and compare performance before vs after.
If you only keep one mental model: Performance explains the movement; Links suggests what might have triggered it. Combining them by URL is the whole point.
Define scope, windows, and the rules for “new links”
This report only works if you lock the scope before you start. If you change the URL set or time windows midway, results will swing for reasons that have nothing to do with links.
Start with the target URL set and stick to it: one important page, a folder, or a small set of templates (like product pages). The tighter the set, the easier it is to connect new referring pages to changes in impressions and average position.
Next, choose two equal time windows. For many sites, 28 days vs the next 28 days is a good default because it smooths day-to-day variation.
Now define “new.” A simple rule: a referring page is “new” if it had zero recorded links to the target URL set before the comparison window, and at least one recorded link during the comparison window. If your link source updates slowly, add a small buffer, for example excluding the first few days of the comparison window from “new link” detection.
To reduce noise, set minimum thresholds before you calculate changes. Otherwise, one random impression can look like a “ranking jump.” For example:
- Only include target URLs with at least X impressions in both windows (example: 100)
- Only include queries with at least Y impressions in both windows (example: 10)
- Require at least Z active days with impressions per window (example: 10 days)
- Ignore position changes when impressions are too low to be stable
Example: in the baseline 28 days, your pricing page gets 1,200 impressions at an average position of 11.2. In the next 28 days, it gets 1,650 impressions at 9.8. Your rules help you treat that as meaningful, while ignoring pages where impressions went from 3 to 9.
If you're tracking placements from a provider (including paid placements), treat each referring page as its own “new referring page” event. That lets you compare outcomes across sources without lumping multiple changes together.
Design a simple data model for the report
Keep the data model boring. Three tables plus shared rules for URLs and dates are enough. If the keys are consistent, the report becomes straightforward joins and comparisons.
1) Target URLs table (the pages you care about)
This is your page catalog. It prevents duplicates when the same page appears with parameters, mixed casing, or trailing slashes.
Store:
- target_url_canonical: the canonical URL you report on
- target_url_normalized: normalized join key (see rules below)
- page_type: category, product, blog, docs, etc.
- notes: optional, like “high value page” or “recently updated”
2) Referring pages table (the new links)
This is the “what changed” input. Each row is a referring page pointing to one of your target URLs.
Store:
- referring_url: exact page that links to you
- referring_url_normalized: normalized for dedupe
- referring_domain: extracted domain (for grouping)
- target_url_normalized: join back to the target URL
- first_seen_date: first date you observed the link (or the date your provider reported)
If one referring page links to two target URLs, keep two rows. The mapping needs to stay explicit.
3) Performance table (Search Console output)
Keep performance data at the lowest useful level so you can roll it up later.
Store:
- date
- target_url_normalized
- query
- impressions
- clicks (optional but usually worth keeping)
- position (average position from Search Console)
Avoid pre-aggregating too early. You can always sum impressions later, but you can't recover query-level detail once it's collapsed.
Join key strategy (the rules that keep everything consistent)
Pick rules once and apply them everywhere:
- Normalized URL: lowercase the host, remove fragments, and standardize trailing slashes. Decide how to handle parameters (often: drop tracking parameters, keep meaningful ones).
- Domain extraction: store the registrable domain or at least the host so you can group by domain cleanly.
- Date buckets: create a date_bucket field like week (YYYY-WW) or month (YYYY-MM) to make comparisons steadier than raw daily charts.
With these three tables and consistent keys, your final report is: new referring pages (by first-seen date) joined to performance changes (by URL, query, and date bucket).
Step by step: pull the data with the Search Console API
Start with performance data you trust, then add new referring pages from a separate source. The standard Search Console API is built for performance reporting, not a full Links report export.
1) Get access to the right property
Pull data from the same property your team uses in Search Console (Domain property vs URL-prefix property). Using the wrong one makes links or rankings look like they “disappeared” when you're just looking at a different dataset.
Before you run anything, confirm:
- your Google account has permission on the property (Owner or Full user)
- the Search Console API is enabled in the Google Cloud project
- you can list the site in the API (quick sanity check)
2) Pull performance by page + query (daily if possible)
Use the Search Analytics query method. Choose a date range, then request dimensions that let you tie changes back to a specific URL and search term.
A practical starting point:
- Dimensions: date, page, query
- Metrics: clicks, impressions, position
- Optional filters: fixed country/device if your site varies a lot
Adding dimensions increases row count. Plan to paginate using startRow until you hit the end.
Here’s a minimal request body (shape only) you can reuse in your script:
{
  "startDate": "2026-01-01",
  "endDate": "2026-01-31",
  "dimensions": ["date", "page", "query"],
  "rowLimit": 25000,
  "startRow": 0
}
3) Get “new referring pages” data (what’s possible)
Search Console's Links report is useful in the UI, but Google doesn't expose the same “top linking pages -> target page” dataset through the standard Search Console API.
If you need referring page URLs, you typically have two options:
- Export the Links report from the Search Console UI on a schedule and ingest that file.
- Use a separate backlink source and match referring pages to target URLs.
Either way, keep the raw referring page URL, the target page URL, and a first-seen date (or export date) so you can classify “new” later.
4) Store raw responses before you transform
Save every API response (and the request parameters that produced it) as raw JSON files or rows in a raw table. Reruns become easier when you tweak matching rules, date windows, or filtering. It also helps when someone asks why a URL's average position changed and you need to show what the API returned.
Step by step: clean, match, and calculate changes
This report lives or dies on matching the same URL across datasets. If URLs don't join cleanly, the “impact” becomes random.
1) Normalize URLs so rows actually join
Choose a canonical form for every target page URL, then apply the same rules everywhere (Search Console pages, your backlinks list, and your output).
Common fixes:
- Use one protocol and host style (for example, always https and your preferred host).
- Standardize trailing slashes so /page and /page/ don't split.
- Strip tracking parameters (utm_*, gclid, fbclid) and keep only parameters that change content.
- Handle obvious duplicates like index.html.
After normalization, create a stable key (normalized_url) and join your referring pages table to Search Console performance data on that key.
2) Match queries without turning it into a taxonomy project
Query grouping should answer one question: did visibility grow mainly for branded demand, non-branded discovery, or both?
Keep it lightweight. Two tags per query is usually enough: brand vs non-brand, plus a simple intent bucket (informational, commercial, navigational). Use short, editable rules. For example, brand is “query contains brand or product name,” navigational includes “login” or “pricing,” and everything else is informational or commercial based on a small keyword list.
3) Calculate deltas and align to “first seen”
For each referring page, store link_first_seen as the earliest date you observed it pointing to the target URL. Then align that date to your windows.
A simple rule:
- before_window = 28 days ending the day before link_first_seen
- after_window = 28 days starting on link_first_seen
Compute changes at the (target URL, query group) level, then roll up to URL level. Keep metrics readable:
- Impressions delta = impressions_after - impressions_before
- Position delta = avg_position_after - avg_position_before (negative is better)
- Visibility score = impressions * (1 / avg_position) or another simple weighting you use consistently
- Contribution share = URL delta divided by sitewide delta for the same period
Example: a blog post gets a new referrer first seen on May 10. In the 28 days before, it had 1,000 impressions at position 14. In the 28 days after, it had 1,450 impressions at position 11. Your report shows +450 impressions and -3 positions, and you can see whether the gain came from non-brand informational queries or a branded lift.
If you're tracking placements from a provider like SEOBoosty, store the same link_first_seen field for those placements too so your windows stay comparable across sources.
Build the report views people actually read
A good link-to-query mapping report isn't a spreadsheet with dozens of tabs. It's a small set of views that answer one question quickly: “What changed after this page got new links, and do we trust the signal?”
View 1: URL impact summary (the view you open first)
Start with one row per target URL. Keep it scannable, and make “new referring pages” feel concrete.
Include:
- Target URL
- New referring pages count (in the link window)
- First seen date (earliest new ref page date)
- Impressions delta (before vs after)
- Avg position delta (before vs after)
Add a compact “New referring pages” cell with 2-3 examples (domain + first seen), with the full list available via a drilldown or filter. This is where readers quickly sanity-check whether the links look real or noisy.
View 2: Query impact for one URL (the “why” view)
When someone clicks a URL, show the queries that moved. Limit it to top movers.
A practical layout:
| Query | Impressions before | Impressions after | Position before | Position after | Note |
|---|
Sort by largest impression gains first, then add a filter for declines. Keep a “Note” column for quick context like “brand query” or “SERP feature appeared.”
Context columns that prevent bad calls
If you break out by device, country, or search type, make it obvious in the UI so readers don't mix apples and oranges. A simple header like “Device: Mobile” works.
Add a short manual confidence field per URL: “High” (clear lift across multiple queries), “Medium” (lift but mostly on one query), “Low” (timing overlaps with a site change).
A realistic example scenario (no fancy math)
Focus on one URL for one week, then compare it to a similar week before the links showed up.
Scenario
You publish a blog post: /blog/on-page-checklist. In the week of May 6 to May 12, your link source log shows three new referring pages pointing to that URL. Two are relevant articles and one is a general resource list.
Set two windows:
- Before window: Apr 29 to May 5
- After window: May 6 to May 12
Now pull query-level metrics for that URL from Search Console for both windows and calculate deltas.
What the numbers can look like
For the query “on page checklist,” impressions jump from 1,200 to 2,100 (+900), but average position stays about the same (8.4 to 8.3). That usually means you're being shown more often, but not ranking higher yet. Common reasons include broader eligibility (more long-tail variants) or higher demand.
For the query “on page seo steps,” impressions stay flat (300 to 310), but position improves (14.2 to 10.8). That can happen when trust improves for a narrower set of searches even if demand doesn't change much.
The key is that your report ties the first-seen date of each new referring page to the comparison window and keeps results separated by URL (not blended across the whole site).
How to summarize it in a weekly update
Keep it short and decision-focused:
- What changed: 3 new referring pages to
/blog/on-page-checklist(May 6 to May 12) - What moved: +900 impressions on the main query; position lift on one secondary query
- What it likely means: visibility grew first; rankings may be starting to shift for specific terms
- What to watch: repeat the same comparison next week to see if position catches up
If you're using SEOBoosty placements, this same weekly note format is a clean way to report what happened after each batch without claiming links caused every change.
Common traps that make the report misleading
This report is useful, but it's easy to fool yourself. The biggest risk is turning correlation into a story because the chart looks neat.
Trap 1: “The link appeared, rankings moved, so the link did it”
Dates lining up isn't proof. Search Console data can be delayed, links are discovered slowly, and Google can reprocess signals later. A link can be found on Monday, reported on Thursday, and have any effect (if it has one) after that.
Treat the link as a candidate explanation. Your report should show what changed, not what caused it.
Trap 2: Splitting one page into many “URLs”
If you mix URL variants, you split the signal and your before vs after changes get noisy. Common culprits: http vs https, www vs non-www, trailing slash, uppercase, parameters, and canonicalized pages.
Pick one normalization rule and stick to it. Otherwise you might blame a position drop on “new referring pages” when half your impressions are sitting on a parameter URL.
Trap 3: Uneven comparison windows
Comparing 7 days before to 28 days after (or mixing weekdays with weekends) creates fake lifts and drops. Many sites have strong day-of-week patterns.
If you must use short windows, keep them symmetric and aligned by weekday. For seasonal topics, add context notes (launches, holidays, PR mentions) next to the numbers.
Trap 4: Treating average position as a single truth
Average position can shift just because your impression mix changed. If a page starts showing for a new query at position 35 with lots of impressions, average position gets worse even if your main query improved.
Sanity-check the distribution: did impressions move toward higher or lower positions? Did one new query dominate the after period?
Trap 5: Ignoring indexing and on-page changes
A “link impact” report breaks when the page itself changed. Title rewrites, internal links, template updates, content edits, and indexing issues can all move impressions and position.
Before you credit a new backlink, confirm the page was stable and indexable.
Guardrails that keep the report honest:
- Use equal-length windows (and match weekdays) for every comparison.
- Normalize URLs and group query variants where it makes sense.
- Flag periods with content updates, redirects, or indexing warnings.
- Review query-level movers, not only page averages.
- Treat “new referring pages” as a starting point, then verify with other signals.
Quick checks and next steps
Before you trust any chart, sanity-check the inputs. Link-to-query mapping can look convincing even when URL, link, or query data is mismatched.
Quick checks (5 minutes)
- Confirm the target URL is consistent: canonicalized the way you expect, indexable, and not blocked by noindex, robots, or a wrong canonical.
- Validate the “new referring pages” are real: the page exists, isn't behind a login, and actually links to your page (not just your domain).
- Make sure the link points to the right URL version: http vs https, www vs non-www, trailing slash, parameters, and redirects can split the signal.
- Check sample size before trusting position shifts. Low impressions make average position swing wildly.
- Scan the same window for other changes: title edits, template updates, redirects, internal linking changes, PR launches, or seasonal demand shifts.
Example: you see a new referring page and average position for a query improves from 14 to 9. If the page only had 30 impressions before and 40 after, that jump may be noise. If it had 5,000 and 6,000 impressions, it's more likely real.
Next steps that keep the report useful
Consistency matters more than fancy formulas.
- Monitor weekly using the same windows and rules.
- Add annotations for link drops and major site changes.
- Flag “high-confidence” pages: stable URL, strong impression volume, and a clear new referring page that links directly.
- Re-check after 2 to 4 weeks. Links and rankings rarely move in lockstep, and Search Console data can lag.
If you want cleaner before-and-after tests for specific URLs, controlled placements help because you can log exact targets and dates. For example, SEOBoosty (seoboosty.com) offers subscription access to curated backlink placements, which can make it easier to compare results across similar link events.
Keep the checks lightweight and regular. The report stays readable, and you spend less time arguing about edge cases.
FAQ
What is the main goal of link-to-query mapping in Search Console?
Start by measuring whether a specific URL gained visibility for specific queries after new referring pages were first observed. Treat it as correlation you can investigate, not proof that one link caused a ranking change.
How long should my “before” and “after” windows be?
Use two equal-length windows so normal day-to-day swings don’t drown out the signal. A practical default is 28 days before and 28 days after, and if your traffic has strong weekday patterns, keep the windows aligned by weekday.
How do I define a “new referring page” without fooling myself?
Define “new” as a referring page that did not appear in your baseline window and then appears during the comparison window. If your link data arrives late, add a small buffer so the first few days of the after window don’t get misclassified as “new link” days.
Why do my URLs not match between performance data and link data?
Always normalize URLs the same way everywhere: Search Console pages, your link export, and your report output. The most common fixes are standardizing trailing slashes, removing tracking parameters, and avoiding splits between http/https or www/non-www versions.
Can I get referring page URLs directly from the Search Console API?
Use the Search Analytics endpoint for performance metrics like impressions, clicks, and average position by page, query, and date. For referring page URLs, plan on exporting the Links report from the Search Console UI on a schedule or using another backlink source, because the standard API doesn’t provide a full “linking page to target page” export like the UI.
How should I interpret average position changes in the report?
Average position can move just because your impression mix changed, not because the page truly improved for its main queries. When you see a position shift, confirm which queries gained impressions and whether the page started showing for many new low-ranking queries that drag the average down.
What thresholds should I use so the results aren’t just noise?
Set minimum thresholds so tiny numbers don’t look like major wins or losses. A simple approach is to require a baseline level of impressions in both windows (for the page and the query) and enough active days with impressions to reduce random swings.
How do I align performance changes to the date a link was first seen?
Store a first-seen date per referring page and use it to anchor your windows, such as 28 days before and 28 days after that date. This keeps comparisons consistent across different link events and helps you avoid blending multiple changes into one story.
Which Search Console property should I use for this report?
Use the same Search Console property type your team relies on, and don’t mix a Domain property with a URL-prefix property in the same analysis. Mismatched properties can make links and performance look like they disappeared when you’re actually looking at different datasets.
How can I use this report to validate backlinks from a placement service?
Log each placement as its own referring page event with a recorded first-seen date and the exact target URL it points to. If you use a service like SEOBoosty, this report is a practical sanity check that focuses on whether the targeted URL’s query visibility moved, rather than relying on sitewide averages that can hide what happened.